

Less report preparation.
More time for insight.
Ask questions of your live athlete data in plain language. AAVA brings answers, tables and charts into the staff Hub, helping your team explore the evidence without first assembling a separate report.
Ask the question and see the evidence.
Which players had the highest high-speed running load this week?
The highest high-speed running load this week was Zane Kowalski with 110.78 m, followed by Daniel Mbatha on 87.44 m and Theo Lindqvist on 71.35 m. This is total HSR summed across each player's drill rows for the week. [1]
| Zane Kowalski | 110.78 m |
|---|---|
| Daniel Mbatha | 87.44 m |
| Theo Lindqvist | 71.35 m |
| Finn Gallagher | 64.2 m |
| Diego Serrano | 52.9 m |
| Cleo Hartley | 41.6 m |
| Felix Brandt | 33.1 m |
| Caleb Ross | 26.4 m |
| Arjun Patel | 18.7 m |
| Isaac Thorne | 0 m |
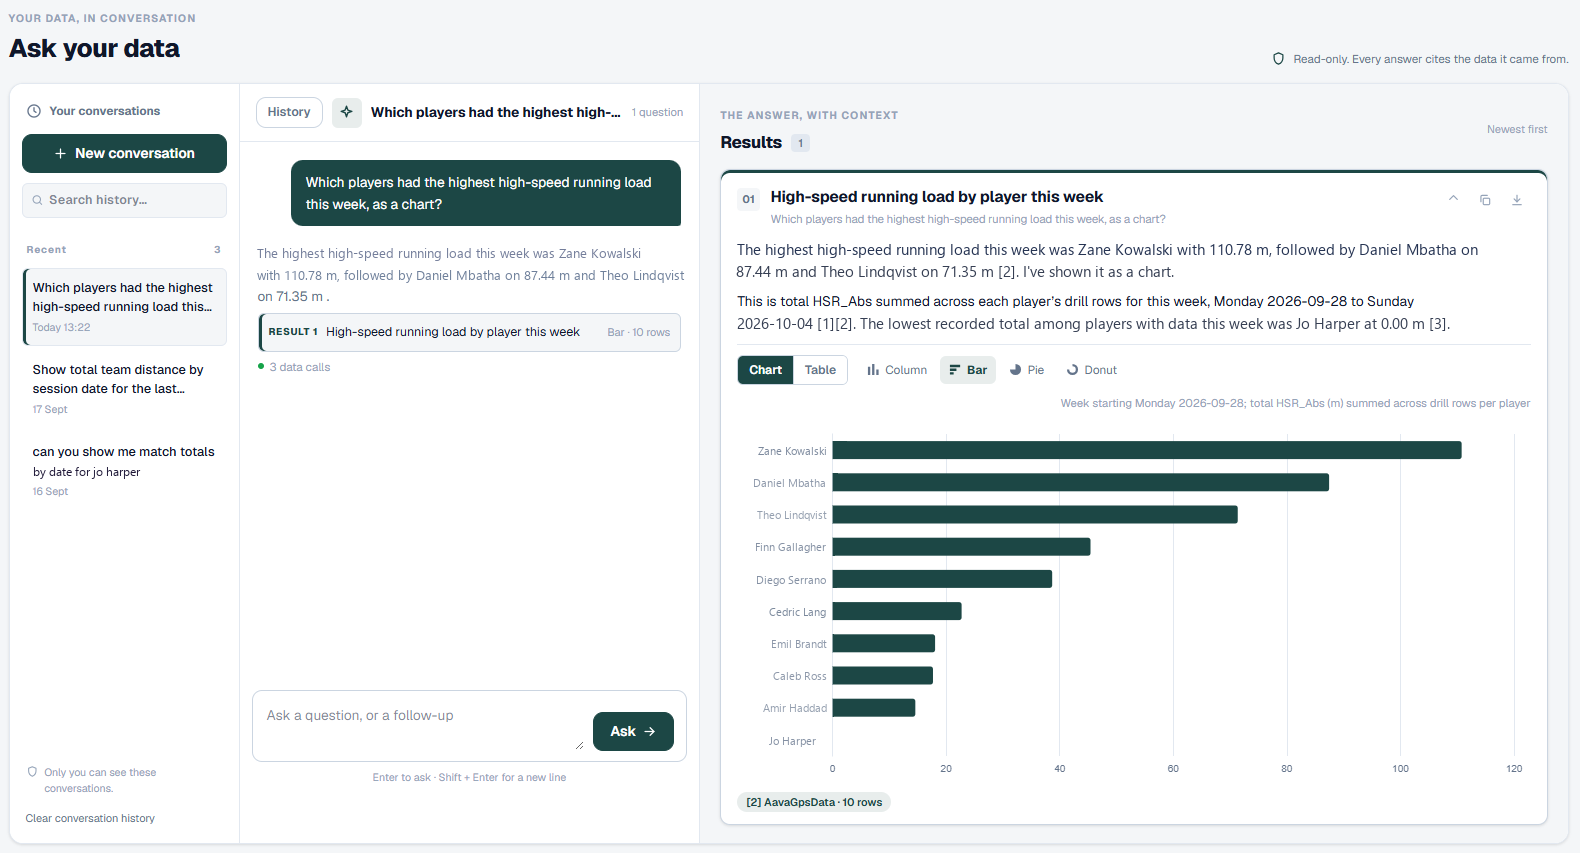
Type the question, get the chart.
AAVA reads your live Elevate database, not a snapshot. Ask about an athlete, a squad or a metric and it returns the answer with the data and a chart you can switch between bar, line, area or combo on the spot.
Which players had the highest high-speed running load this week?
Who's declining on readiness this week?
Add the AC ratio to the 2nd y axis
Trustworthy by design.
Permission-aware
AAVA only reads what that user can already see. Roles and team access apply to every question, and every question hits the audit log.
Honest about gaps
Missing sessions are called out in the answer, not quietly filled in. You see what the data says and what it doesn't.
Configured for your deployment
AI services are configured for your deployment, with support for Azure OpenAI. Discuss provider settings and data handling with us during your technical review.

More time to apply your expertise.
Give coaches and practitioners a direct way to explore routine data questions. Spend less time requesting extracts and preparing charts, and more time interpreting the evidence together.
- Athlete-level trends against their own baseline.
- Squad rankings, distributions and comparisons.
- Charts you can steer: switch type, add a second axis, refine the window.
Ask AAVA a question about your squad.
We will explore it using sample data in a working deployment, including the supporting charts and access controls.